
Project Video
City planner - NASA Space Apps Challenge 2025
Satellite + city data pipeline with anomaly detection and interactive layers.
Quick Facts
- Role
- Backend + data pipeline (FastAPI, notebooks, anomaly detection)
- Team
- 5 people
- Domains
- DataMLWeb
Key Decisions
- Normalized heterogeneous spatial datasets into a common grid to make downstream analysis repeatable.
- Used Isolation Forest for unsupervised anomaly detection due to lack of labels and fast iteration needs.
- Exposed processed results via API endpoints so the frontend stayed focused on visualization and UX.
Results
Tech Stack
About This Project
UrbanLens — Data Pathways to Healthy Cities
Overview
This project was a hackthon for the NASA space app challenge at Lucern. We were a team of 5 people and decided
to tackle the theme Data Pathways to Healthy Cities and Human Settlements.
Our project is a website, showing different layers of enivorment data over the city of Zurich. The data gathered is of different format and saved in one central place. We analyzed the data using Python and Jupyter notebook. Our effort included unsupervised machine learning to find anamolys in the different layers.
Key Features
- Integrates NASA and ESA satellite data:
- Temperature layer
- From open Earthdata
- Soil Sealing
- From open Earthdata
- Air pollution
- Gathered from Opensense map and inverse distance approximation
- Population Density
- NASA data
- Transportation
- Interactiv layer, where you can see, how far you can travel in 10 minutes
- Tree Cover
- NASA Data
- Public Land
- Data from zurich
- Temperature layer
- Detects environmental anomalies with unsupervised ML
- Visualizes findings on an interactive web dashboard
Technical Implementation
I mainly worked on the backend — setting up a Python API and analyzing data through Jupyter notebooks.
The backend handled data ingestion, preprocessing, and running ML-based anomaly detection. Processed results were then exposed via endpoints for visualization on the web client.
Data Processing & ML
- Normalized multiple datasets (soil, vegetation, temperature) into a uniform grid format
- Automation of data download and analysing
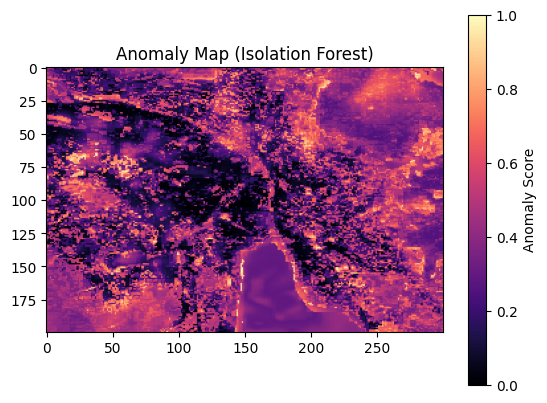
- Developed an unsupervised Isolation Forest model to detect anomalies. This is shown in the map below, where a higher z-Score means unusual data.
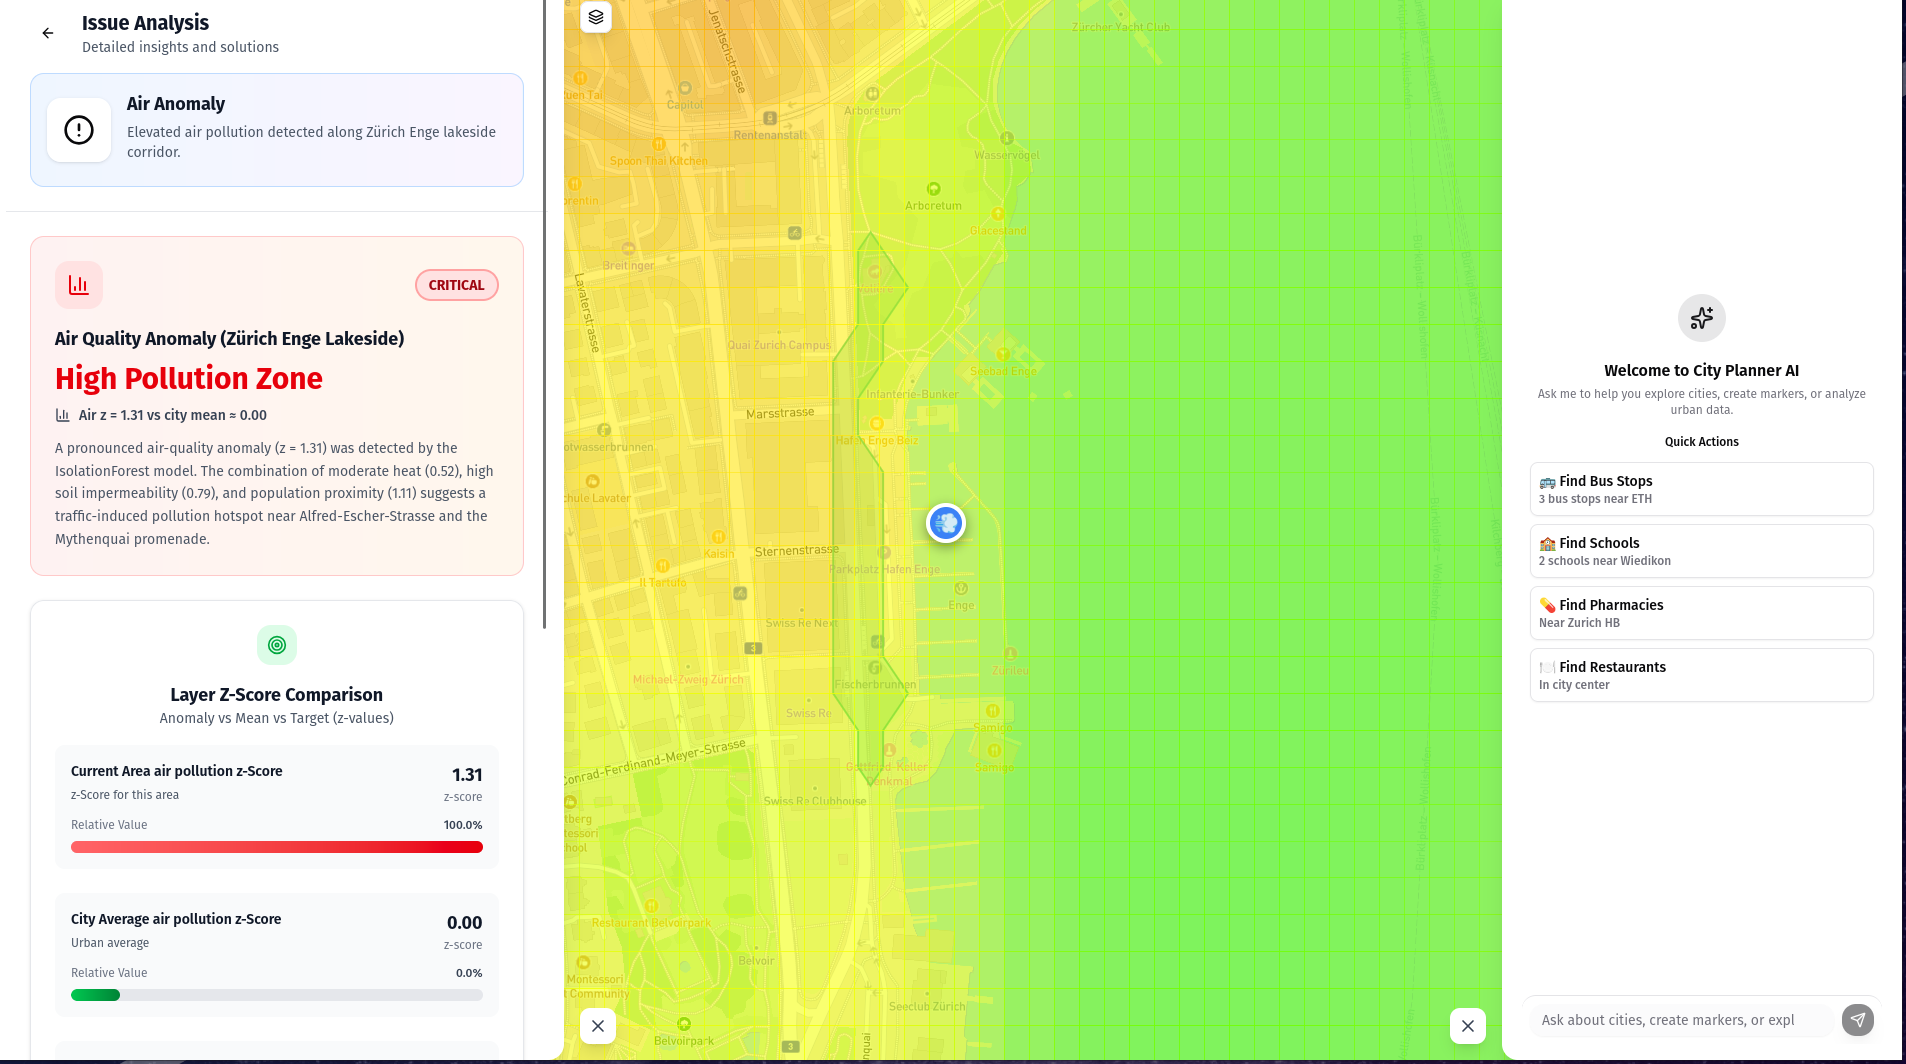
- If we focus on the place at the lake, our website displays the following data:
Challenges Overcome
- Heterogeneous data formats: Merged satellite and city data of varying resolutions and projections into a unified dataset.
- Anomaly detection: Designed a robust pipeline to identify meaningful urban anomalies without labeled data.
Technologies Used
- Python (FastAPI) — backend API and data processing
- Jupyter Notebook — data analysis and model development
- Scikit-learn — Isolation Forest anomaly detection
- GeoPandas / Rasterio — spatial data processing
- React + Next.js — frontend visualization
- Vercel — deployment